CAT 2024 Slot 2 DILR · Question 20
The two plots below give the following information about six firms A, B, C, D,
E, and F for 2019 and 2023.
PAT: The firm's profits after taxes in Rs.
crores,
ES: The firm's employee strength, that is the number of employees in the
firm, and
PRD: The percentage of the firm's PAT that they spend on Research and
Development (R&D).
In the plots, the horizontal and vertical coordinates of point
representing each firm gives their ES and PAT values respectively. The PRD values of each
firm are proportional to the areas around the points representing each firm. The areas are
comparable between the two plots, i.e., equal areas in the two plots represent the same PRD
values for the two years.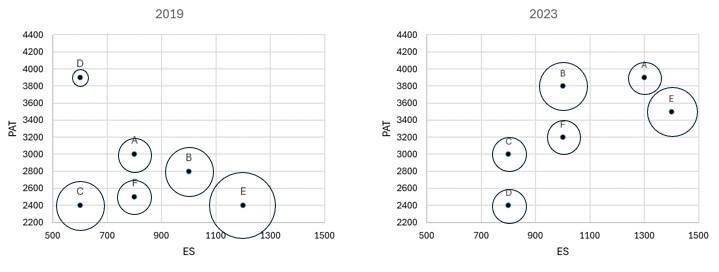
The ratio of the amount of money spent by Firm C on R&D in 2019 to that in 2023
is closest to
- A.5 : 9
- B.9 : 5
- C.9 : 4
- D.5 : 6
Sign in free to see the answer and the step-by-step solution.
Show answer