CAT 2024 Slot 1 DILR · Question 17
The chart below shows the price data for seven shares – A, B, C, D, E, F, and G
as a candlestick plot for a particular day. The vertical axis shows the price of the share
in rupees. A share whose closing price (price at the end of the day) is more than its
opening price (price at the start of the day) is called a bullish share; otherwise, it is
called a bearish share. All bullish and bearish shares are shown in green and red colour
respectively. 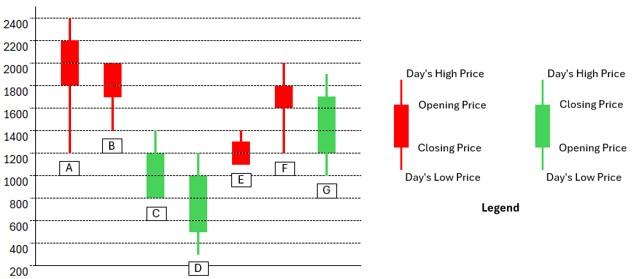
What would have been the percentage wealth gain for a trader, who bought equal numbers of all bullish shares at opening price and sold them at their day's high?
- A.100%
- B.80%
- C.72%
- D.50%
Sign in free to see the answer and the step-by-step solution.
Show answer