CAT 2019 Slot 2 DILR · Question 7
To compare the rainfall data, India Meteorological Department (IMD) calculated the Long Period Average (LPA) of rainfall during period June-August for each of the 16 states. The figure given below shows the actual rainfall (measured in mm) during June-August, 2019 and the percentage deviations from LPA of respective states in 2018. Each state along with its actual rainfall is presented in the figure.
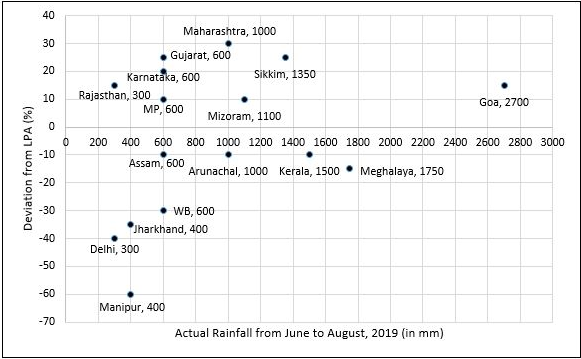
What is the average rainfall of all states that have actual rainfall of 600 mm or less in 2019 and have a negative deviation from LPA?
- A.450 mm
- B.367 mm
- C.460 mm
- D.500 mm
Sign in free to see the answer and the step-by-step solution.
Show answer