CAT 2018 Slot 2 DILR · Question 13
Each of the 23 boxes in the picture below represents a product manufactured by one
of the following three companies: Alfa, Bravo and Charlie. The area of a box is proportional to
the revenue from the corresponding product, while its centre represents the Product popularity
and Market potential scores of the product (out of 20). The shadings of some of the boxes have
got erased.
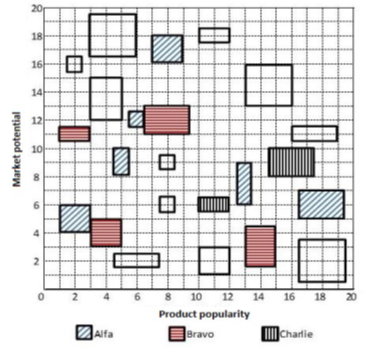
The companies classified their products into four
categories based on a combination of scores (out of 20) on the two parameters - Product
popularity and Market potential as given below:

The following facts are
known:
1. Alfa and Bravo had the same number of products in the Blockbuster category.
2.
Charlie had more products than Bravo but fewer products than Alfa in the No-hope category.
3. Each company had an equal number of products in the Promising category.
4. Charlie did
not have any product in the Doubtful category, while Alfa had one product more than Bravo in
this category.
5. Bravo had a higher revenue than Alfa from products in the Doubtful
category.
6. Charlie had a higher revenue than Bravo from products in the Blockbuster
category.
7. Bravo and Charlie had the same revenue from products in the No-hope
category.
8. Alfa and Charlie had the same total revenue considering all products.
Considering all companies products, which product category had the highest revenue?
- A.No-hope
- B.Doubtful
- C.Promising
- D.Blockbuster
Sign in free to see the answer and the step-by-step solution.
Show answer