CAT 2018 Slot 1 DILR · Question 13
The multi-layered pie-chart below shows the sales of LED television sets for a big
retail electronics outlet during 2016 and 2017. The outer layer shows the monthly sales during
this period, with each label showing the month followed by sales figure of that month. For some
months, the sales figures are not given in the chart. The middle-layer shows quarter-wise
aggregate sales figures (in some cases, aggregate quarter-wise sales numbers are not given next
to the quarter). The innermost layer shows annual sales. It is known that the sales figures
during the three months of the second quarter (April, May, June) of 2016 form an arithmetic
progression, as do the three monthly sales figures in the fourth quarter (October, November,
December)of that year.
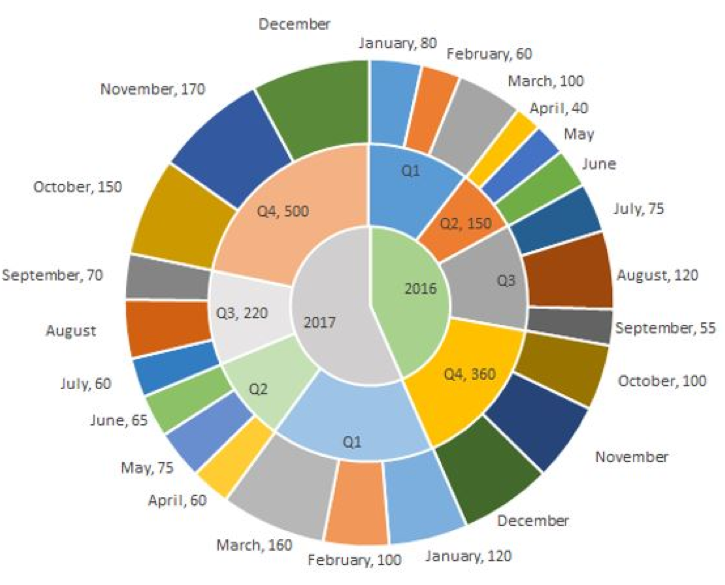
What is the percentage increase in sales in December 2017 as compared to the sales in December 2016?
- A.22.22%
- B.28.57%
- C.50.00%
- D.38.46%
Sign in free to see the answer and the step-by-step solution.
Show answer